Average Cost of Living in the U.S. 2023
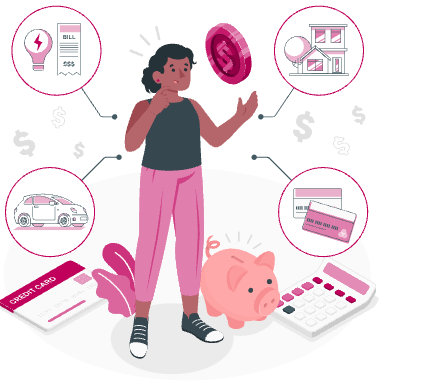
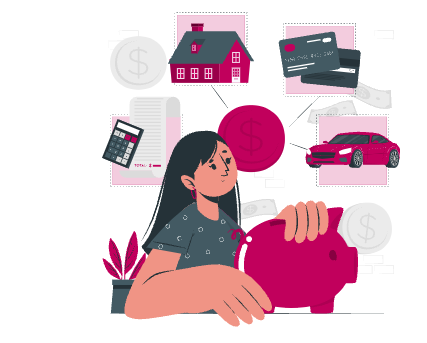
The cost of living has increased significantly in recent years, resulting in a higher expenditure for essential items such as housing, food, and transportation. In order to gain insight into the average household budget this blog post presents the latest statistics on American spending in these areas, including transportation, housing, taxes, and food.

Key Takeaways: March 2023 Data
✓ The typical monthly expenses for individuals amount to approximately $4,009, and the annual expenses would amount to approximately $48,108.(Ramsey Solutions)
✓ The average monthly expenses for a typical American household are reported to be $5,577, which amounts to approximately $66,928 per year. It is noteworthy that this figure is remarkably close to the average annual income of $78,743 after taxes.
✓ For tax year 2023, the foreign earned income exclusion is $120,000 up from $112,000 for tax year 2023. (IRS)
✓ In May, the Consumer Price Index for All Urban Consumers increased 0.1 percent and rose 4.0 percent over the last 12 months. Excluding food and energy, the index increased 0.4 percent in May and 5.3 percent over the year. (BLS)
✓ The average monthly spending on housing and housing-related costs is 34.9%, or approximately $1,784. (Worldpopulationreview)
✓ The Social Security cost-of-living adjustment for March 2023 was announced to be the highest in 40 years at 5.9%, due to increased cost of living, with predictions for the next months in 2023 possibly reaching 8.9%. (Bankrate)
Section 01
The Average Cost of Housing
Section 02
Average Cost of Transportation
Section 03
Average Tax Expenses
Section 04
Average Food and Other Expenses
Section 05
Average Cost of Living by State
Section 06
Average Cost of Living by Family Type and Size
Section
01
The Average Cost of Housing
The majority of Americans spend their money on essential living expenses, including housing, taxes, food, and transportation. These expenses make up around 78% of the budget for an average American.

The average expenditure of American households is estimated to be $61,334 annually, equivalent to a monthly average of $5,111. This accounts for approximately 82% of their after-tax income.
A majority of households face similar primary expenditures, with housing, transportation, taxes, and food accounting for 78% of their total budgets.
The average monthly expenditure for American households is estimated to be $5,111.
The average monthly expenses for households is estimated to be $5,577, which amounts to an annual average of $66,928.
The average annual after-tax income is estimated to be $78,743.
In July 2022, the index for all goods, excluding food and energy, rose by 5.9%.
The US Census Bureau reports that, in the second quarter of 2020, the median asking rent in the United States increased to $1,033 per month within the Construction sector.
First-time homebuyers accounted for approximately 33% of total sales.
The National Association of Realtors (NAR) reports that the percentage of first-time homebuyers in total sales was 33% in August 2020, a decrease from the previous month's 34%, but an increase from 31% in the same month a year prior.
The median sales price for new houses in the United States was $330,800 in March 2021, according to data on the cost of purchasing an apartment.
According to the data, the average sales price for homes in the United States was $397,800 in the year 2022.
Furthermore, in August 2020, all-cash sales accounted for 18% of all real estate transactions, a slight decrease from 19% in the same month a year prior.
Individual investors, who are responsible for a significant portion of cash sales, purchased 14% of homes in August 2020, the same percentage as in the previous year.
The average household in the United States incurs an expenditure of $21,409 annually, or $1,784 monthly, on all housing-related expenses.
Housing costs make up $1,050 of the average monthly budget.
This housing expenditure encompasses various costs, such as rent or mortgage payments, mortgage interest, property taxes, maintenance and repairs, as well as insurance.
The remaining $734 per month of the housing budget is allocated to cover expenses such as utilities, household items, furniture, and equipment.
Approximately 66% of people in the United States are homeowners.
Homeowners, on average, incur monthly expenses of $623 for mortgage interest, property taxes, and other housing-related costs such as maintenance, repairs, and homeowners insurance.
The 34% of Americans who are renters pay, on average, slightly less than homeowners at $607 per month. This includes rent, maintenance costs, and renters insurance.

Section
02
Average Cost of Transportation
The second-largest spending category for the typical U.S. family is transportation.
The average yearly cost of transportation for a household is estimated to be $9,826, equating to roughly $819 per month. This amount represents approximately 12% of the average household income.
Furthermore, the average expenditure for car insurance is $1,575 per year.
Gasoline accounts for 16% of the transportation expenses, with the average monthly spending on gas being $131.
The transportation category also encompasses travel expenses for vacations, such as airfare, bus tickets, train tickets, and even cruise ship fares.
45 percent of video game players in the United States are female, with the remaining 55 percent being male.
Approximately 35% of households in America own three or more vehicles.
Transportation costs vary by state, with the costs in metropolitan areas ranging from $435 to $1000 per month.
When it comes to transportation costs, Hawaii holds the top spot with an index of 144.4.
Hawaii is followed by California at 136, Oregon at 129, Washington at 122, and Alaska and Nevada tied at 118.
The states with the lowest transportation costs include Wyoming, Tennessee, West Virginia, Arkansas, Mississippi, New Mexico, and Texas, with index values of 90 and below.
The average annual cost of car insurance in the United States is estimated to be $2,388, equating to approximately $199 per month.
The minimum coverage rate for a car insurance policy can be as low as $876 per year, or $73 per month.
On average, Americans allocate approximately 2.44% of their household income towards car insurance expenses each year.
The national average cost of car insurance in the United States ranges from $1283 to $1,758 annually, or from $107 to $147 per month.
Over the most recent five years of data, car insurance rates have been on the rise, with an average increase of 4.68%.
Louisiana has the highest insurance rates for full coverage, with an average annual cost of approximately $3,279.
Section
03
The Average Tax Expenses
In this section we include information on how much Americans spend on average on taxes.

The average household pays $9,402 annually in personal taxes.
This constitutes approximately 11% of their total income.
In the year 2020, the federal tax payments were lower than normal due to the stimulus checks received by many Americans during the COVID-19 pandemic.
The typical household received $1,911 in stimulus payments from the government.
For tax year 2023, the standard deduction for married couples filing jointly has increased to $27,700, a rise of $1,800 from the previous year.
For tax year 2023, the standard deduction for single taxpayers and married individuals filing separately has risen to $13,850, an increase of $900. Meanwhile, for heads of households, the standard deduction will be $20,800, a rise of $1,400 from the previous tax year.
For tax year 2023, the marginal tax rate for individual single taxpayers with incomes exceeding $578,125 ($693,750 for married couples filing jointly) remains at 37%.
For individual taxpayers, the tax rate of 35% is applied to incomes over $231,250.
For those with incomes over $182,100, the tax rate is 32%.
If an individual's income exceeds $95,375, the tax rate drops to 24%.
For those with incomes over $44,725, the tax rate is 22%.
For incomes over $11,000, the tax rate is 12%.
The minimum rate of 10% applies to single individuals with an annual income of $11,000 or less and to married couples filing jointly with a combined income of $22,000 or less.
The 2023 Alternative Minimum Tax exemption amount is $81,300 with phase out starting at $578,150 for individuals and $126,500 with phase out starting at $1,156,300 for married couples, compared to the 2022 exemption.
The 2023 maximum Earned Income Tax Credit amount is $7,430 for taxpayers with three or more qualifying children, an increase from the 2022 amount of $6,935.
For 2023, the monthly limit for qualified transportation fringe benefit and qualified parking increases to $300, a $20 increase from the 2022 limit.
For 2023 taxable years, the employee salary reduction limit for contributions to health flexible spending arrangements increases to $3,050, with a $610 maximum carryover amount for cafeteria plans, an increase of $40 from 2022.
For 2023, self-only Medical Savings Account coverage requires an annual deductible of $2,650-$3,950 and a maximum out-of-pocket of $5,300, up from 2022.
For 2023, family coverage in a Medical Savings Account requires an annual deductible of $5,300-$7,900, an increase from the 2022 deductible limit of $4,950-$7,400.
For 2023, the exclusion for foreign earned income has increased to $120,000, up from the 2022 amount of $112,000.
The 2023 basic exclusion amount for estates of decedents is $12,920,000, an increase from the 2022 amount of $12,060,000.
For 2023, the annual gift exclusion has increased to $17,000, up from the 2022 amount of $16,000.
For 2023, the maximum credit allowed for adoptions is the amount of qualified adoption expenses up to $15,950, an increase from the 2022 amount of $14,890.
For family coverage, the maximum out-of-pocket expense limit has increased to $9,650 for 2023, up $600 from the limit in 2022.
Section
04
Average Food and Other Expenses
Food and other expenses have increased in prices. Keep on reading to find out more.
In December, the overall food index rose by 0.3%, following a 0.5% increase in November.
The food consumed at home saw an increase of 0.2%, with three out of the six major grocery store food groups experiencing growth.
The index for meats, poultry, fish, and eggs rose 1.0% with eggs alone surging 11.1%.
The index for other food at home increased 0.4% and nonalcoholic beverages rose 0.1%.
However, the fruits and vegetables index declined by 0.6% with fresh fruit dropping by 1.9%.
The dairy and related products index fell 0.3% and the cereals and bakery products index remained unchanged.
Food consumed away from home rose 0.4% in December, following a 0.5% increase in November.
The limited service meals index increased by 0.5% and full service meals rose by 0.1%.
Over the past 12 months, the food at home index increased by 11.8%.
The cereals and bakery products index rose by 16.1% with other major grocery store food groups experiencing increases ranging from 7.7% (meats, poultry, fish, and eggs) to 15.3% (dairy and related products).
The food away from home index rose 8.3% in the last 12 months with full service meals increasing 8.2% and limited service meals rising 6.6%.
The average American household spends $2,912 annually on entertainment, which constitutes only 3% of their total income.
The decreased spending on entertainment in 2020 can be attributed to the COVID-19 pandemic and its effects on shutdowns of movie theaters and concerts and an increased focus on staying at home.
On average, 6% of a U.S. household's income, or $5,177 annually, is spent on health care expenses, including health insurance premiums and costs for medical services, prescriptions, and supplies.
The average monthly cost of health insurance premiums is $306, making up 5% of the annual income after taxes and deemed reasonable by the Affordable Care Act if it's less than 8.5% of a household's modified adjusted gross income.
The average American household spends approximately $7,246 annually on Social Security or pension contributions and personal insurance.
On average, a typical American family incurs $2,060 in annual expenses for utility bills.
The typical U.S. family spends an average of $60 to $120 per month on electricity bills.
They spend between $20 to $80 on natural gas bills.
Additionally, they spend $30 to $70 on internet bills, $50 to $100 on cable bills.
Next, they spend $10 to $40 on water bills.
The exact amounts depend on usage, the number of units, and state charges.
Section
05
Mobile Gaming Statistics
The cost of living varies on the state you live.
Hawaii has the highest cost of living, with a high cost of housing, utilities, and groceries, followed by Washington D.C.
The least expensive states are mostly located in the Midwest and South, with Mississippi being the cheapest state to live in with the lowest housing costs.
Kansas is the second cheapest state, with the lowest grocery costs, but the highest transportation and healthcare costs.
Mississippi has the lowest cost of living in the US with a cost of living index of 83.3, particularly low housing costs, with a median price for a single-family home of $140,818 and average rent for a two-bedroom apartment of $777.
Despite having the lowest cost of living in the US, Mississippi has a high poverty rate of nearly 20% and is consistently ranked as one of the worst states to live in, with a living wage of $80,523 for a family of four and a median income of $70,656.
Kansas has the second-lowest cost of living index in the US at 86.5, with especially cheap housing (index of 72.6) with a median price for a single-family home of $176,898 and an average rent for a two-bedroom apartment of $862/month, although slightly higher than average costs for utilities and healthcare.
A family of four in Kansas needs an annual income of $89,353 to sustain their living expenses, while the median income for a family of four is $92,980 with slightly lower poverty rates than the national average, and a low unemployment rate of 2.5%.
Alabama has a low cost of living index of 87.9, with particularly low housing costs and health and transportation costs.
In Alabama, the living wage for a family of four is $80,777 while the median income is $80,845, but poverty rates are among the highest in the country with 15.6% of residents living in poverty.
Hawaii has the highest cost of living index in the nation, with housing costs three times the national average and groceries 50% more expensive due to the need for shipping, making it the most expensive state in the US except for healthcare.
Despite having a high cost of living, Hawaii has a low poverty rate and a high median income of $118,223 for a family of four, with a living wage for a family being $107,702 per year.
New York has the second-highest cost of living index in the country, with housing 2.3 times the national average and a typical single-family home costing $373,880, with even higher costs in New York City, where a two-bedroom unit averages $5,874 in rent.
A family of four in New York requires a living wage of $110,255 and has a median annual income of $111,054.
California has the third-highest cost of living index in the US at 142.2, with its transportation costs being the second-highest in the country due to high gas prices.
Housing in California is twice the national average, with a typical single-family home priced at $683,996 and an average rent for a two-bedroom apartment of $1,614, with even higher costs in major metropolitan areas like Los Angeles and San Francisco.
A family of four in California requires a living wage of $110,255, and the median family income in the state is $105,232. Unfortunately, California also has the highest rate of homelessness in the country.

Section
06
Average Cost of Living by Family Type and Size
American families have experienced a rise in the costs of many necessities that has made it difficult for them to attain economic security.
Low and middle-income families typically spend a larger portion of their budgets on essential items like food, clothing, housing, transportation, health, education, and care for children and elders.
These families, who make up the bottom 60% of the income distribution, typically spend 75-80% of their budgets on these necessities, leaving them vulnerable to price increases in these areas. The average monthly expenses for a family of five or more are estimated to be $7,400, which totals to an annual amount of $88,797.
At the other end of the spectrum, in 2019, families in the top fifth of the income distribution devoted about 65 percent of their budgets to these basic needs, leaving about 35 percent of their budgets for other, more discretionary items.
Additionally, the findings for high-income families indicate that they often opt for pricier versions of basic necessities, such as more upscale housing or premium groceries.
Families with elderly members allocate a greater portion of their budgets towards health expenses compared to families with young children, leaving them more susceptible to price increases in medical services and prescription drugs.
Families with young children face increased costs for childcare.
Rising childcare costs can impact a family's decision on whether to have a second earner, mainly women, remain in the workforce which can have significant effects on lifetime earnings.
The loss of childcare options during the COVID-19 pandemic has further highlighted this issue.
Families with older children are less affected by childcare costs but are more vulnerable to educational expenses, particularly college tuition.
The typical single-parent family has an annual budget of approximately $49,000, which is approximately half of the budget of the average married family with children.
In 2021, the average monthly expenses varied from $3,405 for an individual to $7,400 for a family consisting of five or more members.
The average monthly expenses for a single person came to $3,405, which is equivalent to $40,859 per year.
It is estimated that the average monthly expenses for a family of two are $5,782.
This results in an annual amount of $69,382.
The average monthly expenses for a family of three are approximately $6,597.
This translates to an annual cost of $79,163.
It is estimated that a family of four incurs average monthly expenses of roughly $7,749.
This amounts to a yearly total of $92,989.